-

How Much it ll cost to build an app like
- Cost to develop an Uber Tow Truck App
- Cost to develop a Pest Control App
- Cost To Develop a Handyman App Like Uber
- Cost To Develop a Doctor Appointment Booking App
- Cost To Develop An App Like MoodBites
- Cost To Develop An App Like SkipTheDishes
- Cost To Develop An App Like Q Chat
- Cost To Develop An App Like TickTick
- Cost To Develop An App Like ContractBook
- Cost To Develop An App Like Utter
-

How Much it ll cost to build an app like
- Cost to develop a Video Editing Mobile App like Magisto
- Cost to develop a Live Video Streaming App like Twitch
- Cost to develop an app like Home Workout- No equipment
- Cost to develop a Sports News app like theScore
- Cost to develop an Application like Reddit
- Cost to develop a Sports News app like theScore
- Cost to develop an E-learning platform like Udemy
- Cost to develop an On Demand Doctor App like Heal App
*

Everything You Need to Know About Mobile App Analytics
The Why, What, How & Key Terms
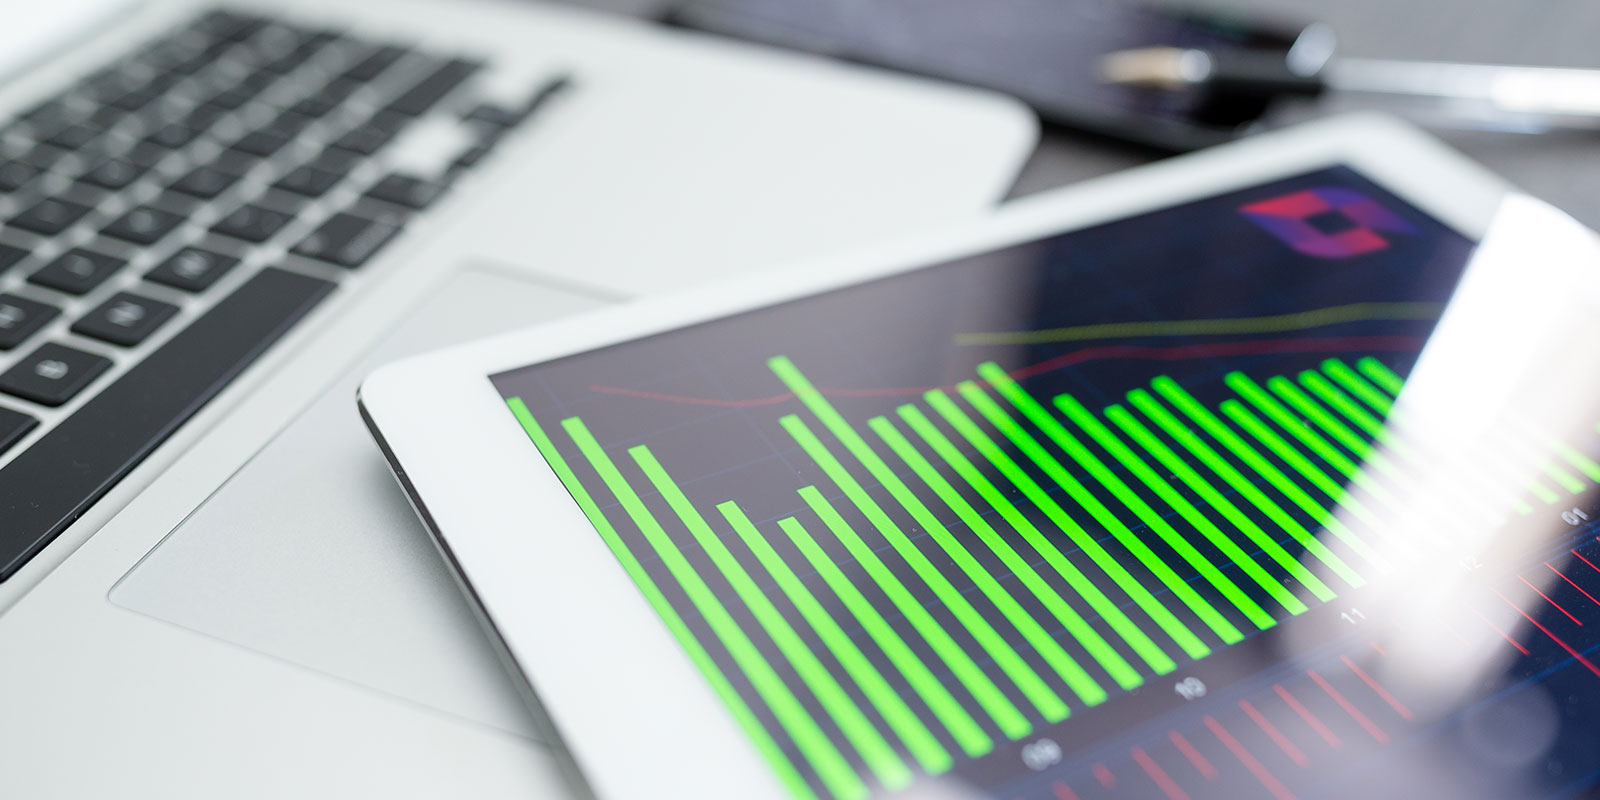
If you are planning on developing, launching, and scaling a mobile application, app analytics are going to be your go-to for understanding key milestones in your app’s growth and success. With mobile app analytics, not only can you gain insight into your users’ behaviour, but you can visualize and address obstacles as they occur in real-time, allowing you to accurately optimize your app. If you’re a new developer or someone looking into having a mobile app made, here is everything you need to know about mobile app analytics.
Getting to Know the Basics – Why, What, & How
Let’s dive into the why behind mobile app analytics. These are essential to the development process for several reasons.
- They provide you with insights into how users are interacting with your app.
- They tell you which parts of the app your users interact with the most.
- They tell you what actions your users take in the app.
With these insights, you can create an action plan around improving your mobile app depending on what your goals are. For instance, you may choose to add in new features that your user base is asking for or improve on existing functions if you find that users are frustrated with a particular section of the app. Other than this, you may choose to remove certain features that aren’t used a lot. Finally, mobile app analytics will also give you in-depth information on key performance indicators (KPIs) which are needed for strategy adjustment.
While all of these things are good, in order to know what to do with your mobile app analytics, you need to know what your app goals are (the what). Your milestones are going to be different than another developer’s as every app is different and has different target audiences. For instance, a mobile game may focus on increasing revenue by increasing its user base and pushing in-app purchases (microtransactions). On the other hand, a retail mobile app may want to increase store traffic or bring about better brand awareness, while streaming apps will focus on getting their user base to subscribe to music plans.
So, now that you know the why behind mobile app analytics and the what, how do you go about tracking these metrics? With mobile app analytic tools! Some of the top ones include:
Firebase
- UXCam.
- Localytics.
- IOS App Analytics.
- Countly.
- Flurry.
- MixPanel.
It is important to note here that all of these tools are going to give you different features, so be sure to do thorough research into what you need to track.
What Are Mobile App Analytic Tools?
Mobile app analytic tools, like the ones mentioned above, will give you key information about how well your application is performing and how it is being used by your audience. In most cases, these tools are going to have features that are common to all of them. Let’s take a look at these features, first.
- Filters. Simply, this is just the ability to filter how you want to see the data collected by the tool.
- The platform includes the app version – android/ios.
- The date is the day in which you are viewing data from. This could be yesterday, last week, or 30-days ago.
- The audience name, so those who share similar traits. These could be new users, milestone subscribers, or repeat purchasers.
- User properties or demographics will use filters like age range, gender, how often this segment of people view ads, device model, app version, and more.
Most of the tools available on the market will allow you to download this information for easy viewing.
- Active Users. With this filter you will be able to view daily users, weekly users, and monthly users plotted over a specific time period that you set. You may be able to see real-time data of users active in the last 30-60-minutes and what conversion events took place during this time. A conversion event is a new user registering for the first time or someone completing the tutorial or making their first purchase.
- Conversions. These are heavy-hitting events – like the ones mentioned above.
- Engagement. This filter will likely show average daily engagement via a graph that displays notable trends.
- Revenue. This filter will show you the total revenue (combined value) received from all sources. It should also show you the individual sources, the average revenue per user, and the average revenue per paid user (subscribers, etc).
- Adoption/Acquisition. This filter will allow you to view user adoption graphs which tell you what percentage of users are using which app version. You will also be able to see your top converting acquisition channels, the lifetime value of users who open your app on specific channels, etc.
- Audience Retention. This will give you information on retention cohorts or rather, which set of users open and use your app at the same time, on the same day, or during the same time in the week/month. You may also be able to see the location (countries), device models, and demographics here.
What Are Mobile App Events?
Once you have chosen a mobile app analytics tool and integrated it into your application, it will begin to capture events and user properties. An event is an important occurrence or trigger that you want to measure, which will be accompanied by a parameter which is the information that contextualizes the event. User property is an attribute that describes the user and their behaviour. You can segment out certain users via their properties.
- Automatic Events. These are collected automatically and are triggered by a basic interaction, such as tapping on an advertisement within the app. These are collected without you coding them in by the SDK.
- Predefined Events. These are very generic events that are typically used by all mobile applications. Common ones include the following:
- When the app is launched for the first time, a user views/clicks an ad, or a user makes a purchase. Or, when they sign up, log in, or perform a search.
- In retail, this could be adding in payment or billing information. Checking out via the cart or adding an item to the cart. Wish listing an item for future purchase.
- In education, jobs, or deals, this could be when a job listing is posted, an item is listed for a certain price point or when a refund is issued.
- In travel or eCommerce, this could be flight numbers, passenger count, hotel bookings, etc.
- Custom Events. Some mobile app analytic tools will allow you to create custom events that go beyond what predefined events allow you to do. A custom event will allow you to measure a certain metric that is important to you and your mobile app specifically. You will need to add custom parameters for these and check naming rules to make sure these events do not conflict with others already programmed into the software.
- User Properties. In here, you will be able to group your user base into segments based around specific criteria thresholds. A user property is simply collected data about the app user rather than information about the app itself. Examples of user properties that typically come pre-generated in the software include gender, age, country, app version, language, and OS version.User properties are useful for reaching certain milestones as it allows you to customize notifications and advertising around user segments. For instance, you can upsell a customer who has made an in-app purchase, give a deal on a previously viewed item, or help someone out whose failed a game level several times.
- User Sessions. This measures how long a user interacts with your app for X period of time. It tells you how much time a user is spending on your app in one sitting and gives insight into how long a user takes before completing other events, such as making an in-app purchase or subscribing.
Most mobile app analytic tools will wait 10 seconds before starting a user session recording. This eliminates users who open the app up by mistake and quickly shut it off. You can change both the start and stop recording options as needed.
What Are Mobile App Analytic Goals?
You will need to set goals for your app – or basically, what you want to achieve with it. It could be anything from generating revenue, brand awareness, increasing downloads, or a combination of any of these. Until you know what your goals are, you won’t know what to look for in your metrics, so make sure to understand what your conversion and event points are. Once you know what your goals are, (increasing 30-day active users by X% in one quarter), you can track the progress by utilizing the data that your mobile app analytics tool captures. With it, you can tweak your strategy to hit your goal.
- Event Tracking. Whether you are just tracking the automatically collected events or inputting and tracking custom events, you will be able to see all statistics associated with these via event tracking. You can set or unset events as needed and then review collected data on how many times this event has occurred and how many users have triggered it. Each event will have broken-down statistics on event location, demographics, and more.
- Conversion Events. This type of event is critical since it identifies who your most valuable users are. Individuals who cause conversion events, such as referring and bringing on new members or clicking on and viewing advertisements, are crucial as they bring in success. Focus on their acquisition channels and replicate these users’, their events, and their app journey.
For example, if you are running marketing campaigns in order to boost app revenue, you will want to focus on conversion events that see users clicking on ads, purchasing in-app digital goods, or subscribing. If your campaign gets you installs but no revenue-boosting conversions, then the campaign would be considered unsuccessful.
- Automatic Conversions. There are three main ones that most mobile app analytics tools will track.
- An App Launching. When a user opens up and launches the app for the first time after an installation or reinstallation.
- App Purchases. When a user chooses to make an in-app purchase and processes it via the App Store (iTunes/Google Play). Parameters captured here are product ID, product name, the currency used, and quantity.
- eCommerce Purchases. This relates specifically to retail apps. When a user makes a purchase, parameters around coupons, currency, value, shipping, transaction identifier, tax, and quantity are collected. For travel, this would also include travel class, passenger number, origin, destination, location, value, currency, date duration, coupons, nights stayed and so on.
- Custom Conversions. These are custom-made events centred around conversions. See conversion events above.
- Conversion Event Tracking. By tracking conversion events, you can see invaluable insights around when the event occurred (time), which channels these conversion events are coming from, and what campaigns are attributed to the completion of the event.
- Audiences/User base. Your audience is a set of users who have the same or similar user properties or events. Examples of these would be “all users” which is everyone who uses your mobile app and “purchasers” who have already made an in-app purchase. You can create new audiences as needed and then view information about them, including their app version, gender, age, interests, and activity.
It is always recommended to create a conversion event audience as these are your most valuable users. Gaining information about their demographics, channel acquisition, and interests will give you data for marketing campaigns.
- Funnels. In most cases, a user isn’t going to go from A – B and convert in a linear line. Rather, there are certain paths that users will take, some different from others. You can use funnels to visualize the steps that users go through on their journey to reaching a certain conversion event, such as an in-app purchase. In looking at these funnels, you will be able to see the different conversion rates for different paths, and thus see if there are any bottlenecks in your app. Take this one step farther and use the user segments and parameters to see which users, behavioural patterns, and conversion rates are a bottleneck and which are successful.
- Cohorts. This is a group of users who use your mobile app around the same time (day/week/month). You can view the retention rate to see who keeps coming back across different time periods.
Wrapping It Up
If you are developing and launching a mobile app, analytics is going to be your best friend. They are going to tell you what works, what doesn’t, and how your app is being used. This, in turn, will help you streamline it for success. To know more about Mobile App analytics, please contact our SEO experts.

Author
Our Partners


WhatsApp us


